Writing with Both Hands!
The results of a survey done about the dominant hands of 8 people are shown below.
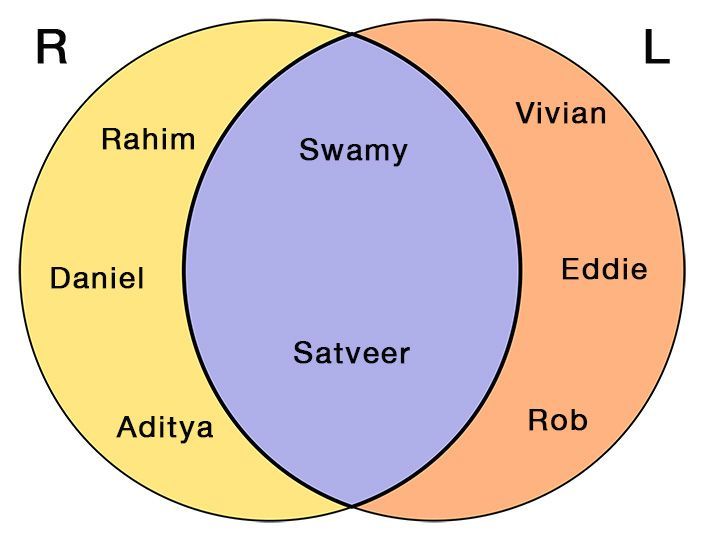
Set R, shown below, were dominant with Right Hand.
R = {Swamy, Rahim, Satveer, Daniel, Aditya}
Set L, shown below, were dominant with Left Hand.
L = {Vivian, Eddie, Swamy, Satveer, Rob}

Represent them as a Venn Diagram.
We have 2 sets here and we have to represent them as Venn Diagrams.
So, the first thing that we need to do is, draw a Sets in a Venn Diagram.
Venn Diagrams. Of 2 sets.
Intersecting sets are represented by overlapping circles.
Draw a Rectangle, that encloses the set.
Draw a Circle/Ellipse for each of the set with elements in it.
Access All Content
Video Explanations, Practice Worksheets and Solved Examples for all Chapters.
Textbook solutions, Formulae and Mindmaps across all boards.
More from Grade 4 Math

Pictograph
Representing your world in pictures! See how the type and number of a quantity can be mathematically represented pictorially.

Venn Diagram Example
Learn how to use Venn Diagrams to solve real world problems with these interesting examples.